Inside the platform
What you actually get for $29.99.
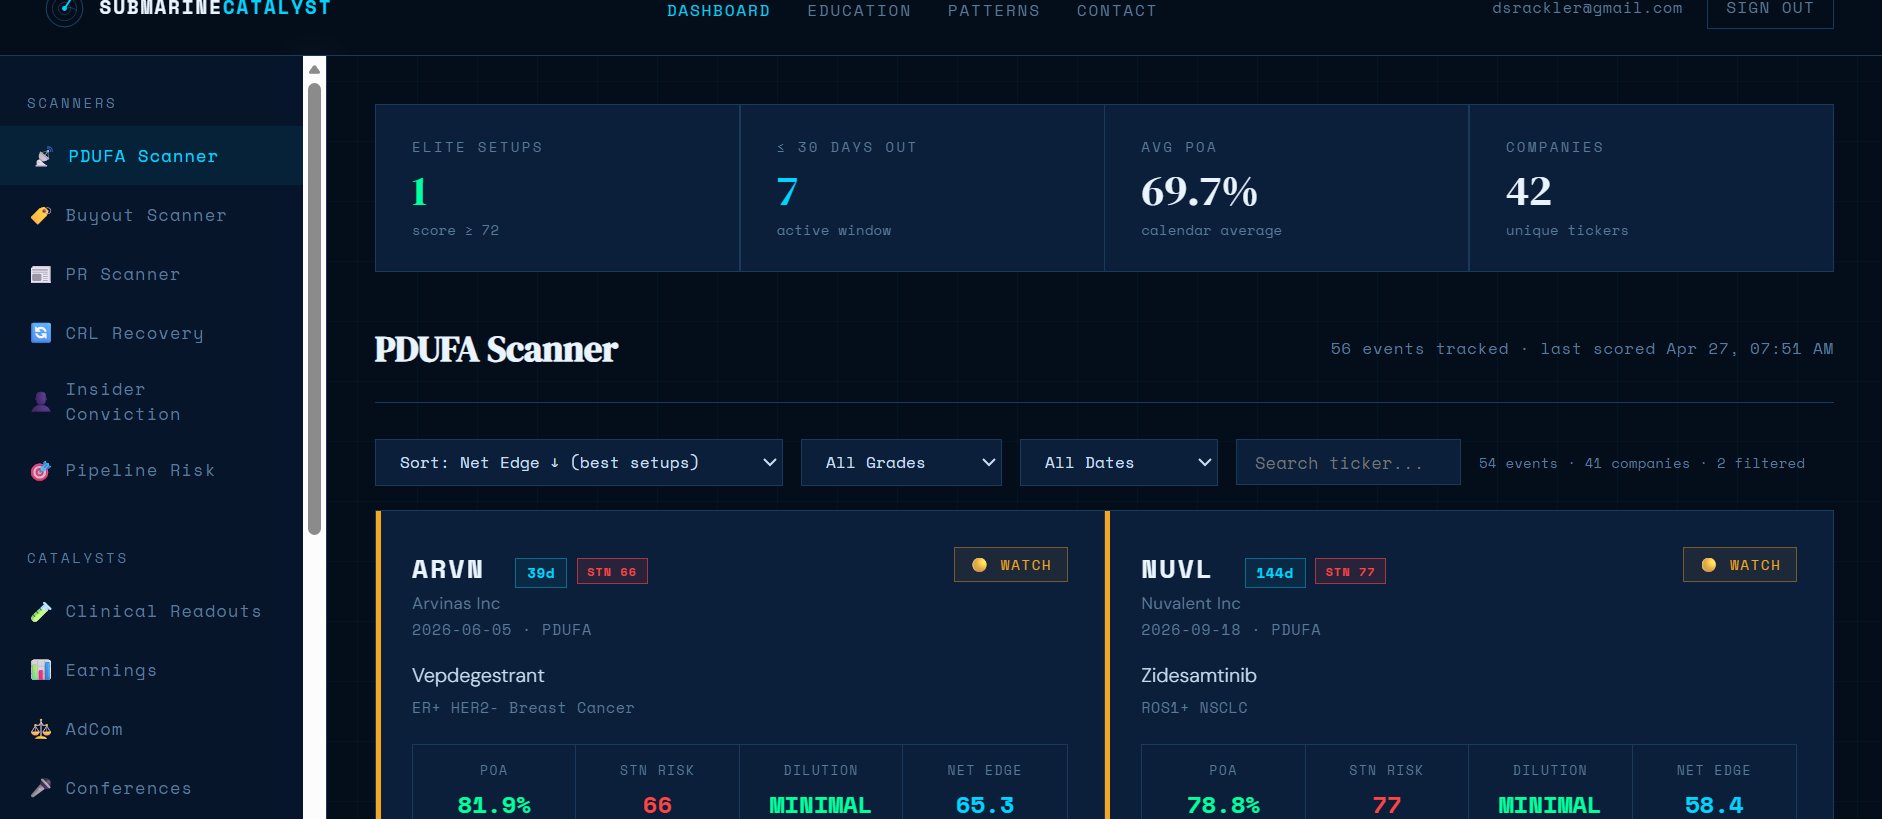
No demo videos. No mockups. This is the live product. Subscribers see this for every ticker, every day.
Get Inside — $29.99/mo →
Cancel any time · Access in 60 seconds
I was spending five hours per ticker reading FDA history, S-3 shelf registrations, and clinical trial data, and still missing the one thing that tanked the trade. So I built a scanner that reads all of it for me, every day. 300+ biotechs worth tracking, plus every company with an upcoming PDUFA. Eight risk layers. Every pre-decision call logged publicly. Wins and losses.
✓ Cancel any time · No contracts · Solo-built by a Navy vet · Billed monthly via Stripe
Every classification logged before the event resolved. Wins and losses both on the record.
| TICKER | SCANNER CALL | RESULT | POST-DECISION MOVE |
|---|---|---|---|
| Loading from database… | |||
Loading summary…
Scanner outputs are quantitative classifications from public data. Not investment advice. Past accuracy does not guarantee future results.
No demo videos. No mockups. This is the live product. Subscribers see this for every ticker, every day.
Cancel any time · Access in 60 seconds
Conservative baseline: a fixed 7.5% of equity on every resolved live call, no concentration on the highest-conviction setups. LONG and SHORT follow the classification's trade_type. No leverage, no overlap, no fee model. The point isn't the dollar return at uniform sizing — it's that with only 12 resolved events the sample is still small, and the equity curve is dominated by the two CRL misses (REPL, GRCE) sized identically to the +45% VNDA win. The full track record page shows the same simulation with concentration toggles and the 73-event Polygon backtest.
A PDUFA calendar without risk scoring tells you when the event is. It doesn't tell you whether the setup is worth trading. That gap is the whole point of this tool.
| DIY research | Calendar-only tools | Bloomberg Terminal | Submarine Catalyst | |
|---|---|---|---|---|
| Monthly cost | $0 + 5 hrs/ticker | $0 – $200 | ~$2,000+/mo | $29.99/mo |
| PDUFA calendar | Manual from FDA.gov | ✓ | ✓ | ✓ 300+ + every filer |
| Probability-of-approval scoring | You guess | ✗ | Analyst reports, not scored | ✓ Hay 2014 · Wong 2019 |
| Sell-the-news risk layer | You guess | ✗ | ✗ | ✓ HIGH flagged REPL -64%, RCKT -20%, ARVN +8% muted |
| Dilution radar (SEC EDGAR) | Manual 424B5 scans | ✗ | Manual | ✓ Auto every 6 hrs |
| Buyout probability model | You guess | ✗ | ✗ | ✓ 14-company patent cliff DB |
| TAM / Market Cap ratio | Spreadsheet | ✗ | ✗ | ✓ Per-indication TAM |
| Live track record (wins + losses) | Your trading journal | ✗ | N/A | ✓ Public, including REPL & GRCE misses |
| Pre-run calibration backtest | ✗ | ✗ | N/A | ✓ 102-event, Feb 2024 → |
| AI deep-dive per ticker | You write it | ✗ | Partial | ✓ Any tracked ticker |
| Runs on your phone | ~ tabs and PDFs | ✓ | Bloomberg Anywhere $ | ✓ |
Bloomberg pricing from publicly reported figures. Calendar-only tools category includes free PDUFA tracker sites and low-cost calendar apps. Comparison is opinion based on my own use of each category — you're welcome to disagree.
Every data point traces back to a public source. FDA filings, SEC EDGAR, ClinicalTrials.gov v2, Federal Register, openFDA, Finnhub, Polygon.io. You can audit any score on any ticker.
PDUFA dates are table stakes. The real signal is what's around them — AdCom meetings, Phase 2/3 readouts, CRL resubmissions.
Every layer is documented, weighted, and recalibrated after each resolved event. This is where the edge lives.
Catalysts don't fire in a vacuum. The rest of the market context — earnings windows, medical conferences, safety reports — all gets scored and placed on the same calendar.
Each signal is sourced and weighted. The RCKT and VNDA panels below show the same model evaluating two approvals — one that made money, one that lost it. Same PoA range, very different outcomes. That's the point.
Submarine Catalyst tracks every FDA binary event across the full market cap spectrum — not just the small-caps retail traders already crowd into.
Highest volatility. Highest spike potential. Highest dilution risk. Where the asymmetric PDUFA trades live — and where STN Risk and the Dilution Radar add the most value.
More institutional coverage, more efficient pricing. Moderate moves on approval (+10 to 25%). sNDA/label expansions are common. STN Risk goes up with coverage.
One drug rarely moves the needle. Tracked for competitive dynamics, pipeline intelligence, and the ripple effects a large-cap approval has on smaller players in the same therapeutic area.
I spent three years in the Navy, most of it on the USS Montana during dry dock in Newport News, Virginia. Eleven months inside a boat that wasn't in the water yet. What you learn in that environment is that everything runs on procedure, verification, and trusting your instruments when your instincts are screaming something else. That stuck with me.
I got medically separated and enrolled at Texas Tech for a BBA in IT Systems. Somewhere between learning SQL and reading SEC filings for fun, I started trading biotech PDUFA events. The problem was obvious pretty fast. I could spend five hours researching a single ticker — FDA history, EDGAR filings, clinical trial data, cash runway math — and still miss the one thing that tanked the trade. So I started building a tool to do the research for me.
That tool became Submarine Catalyst. It started as a Python script on my laptop. Now it runs eight analysis layers across 300+ biotechs I actually track, plus every company with an upcoming PDUFA — updated daily by an automated pipeline that costs me less than $30 a month to operate. I'm 23, I'm still in school, and I built this because I needed it. Turns out other people need it too.
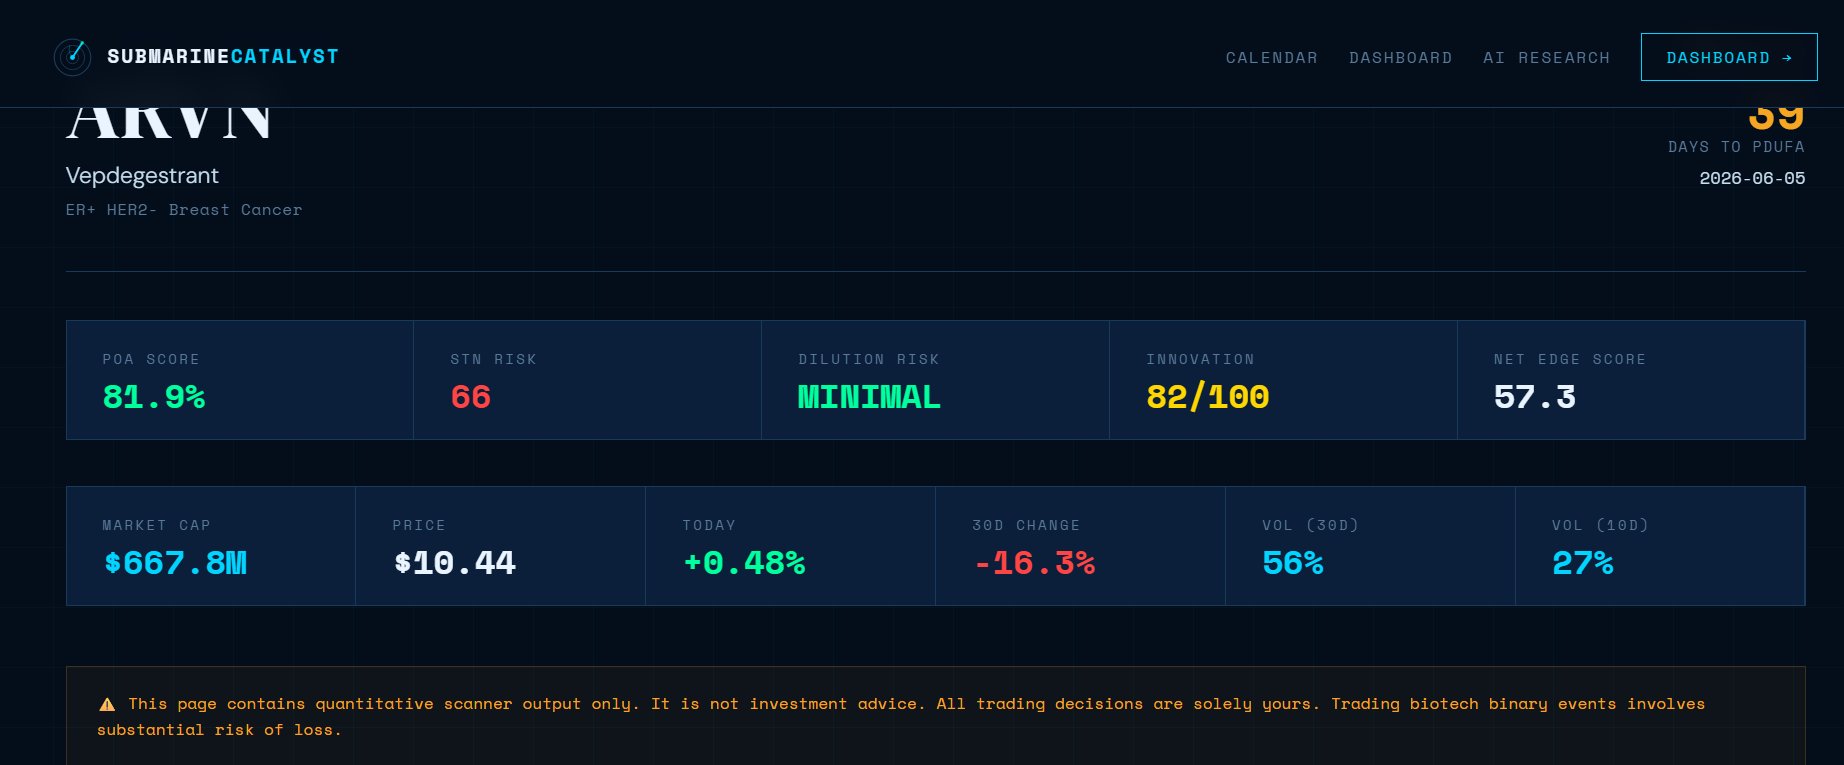
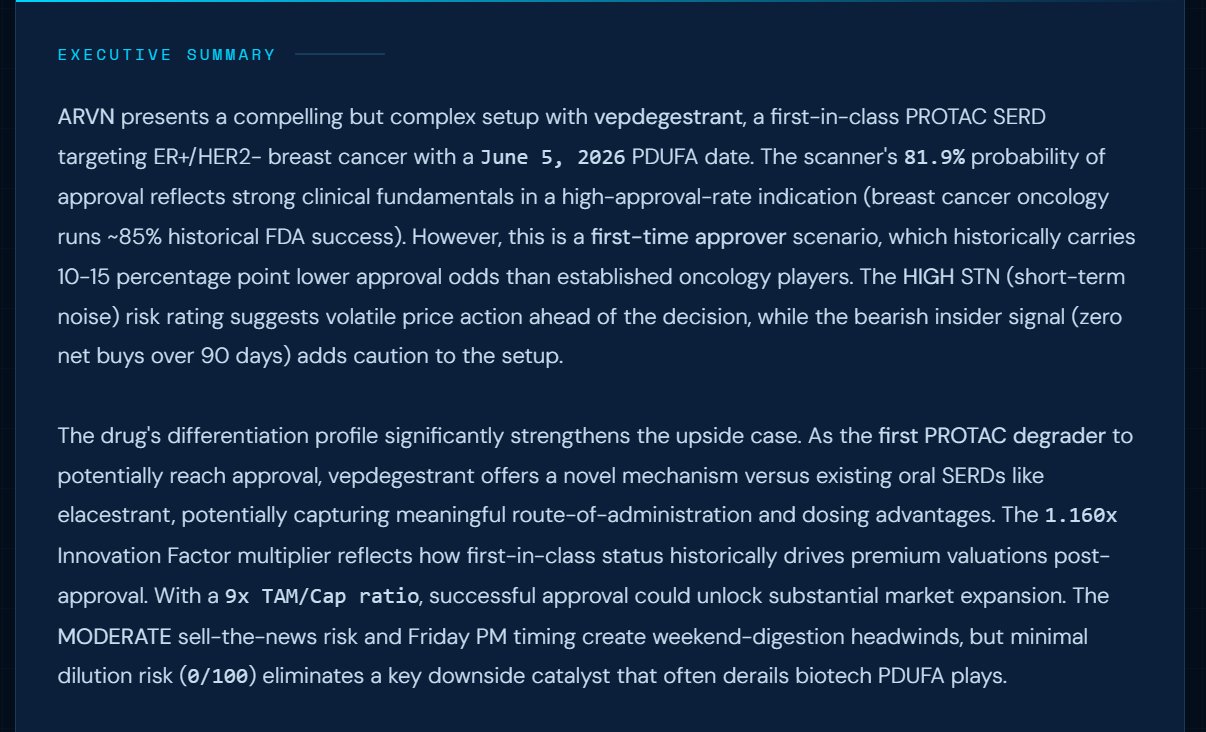
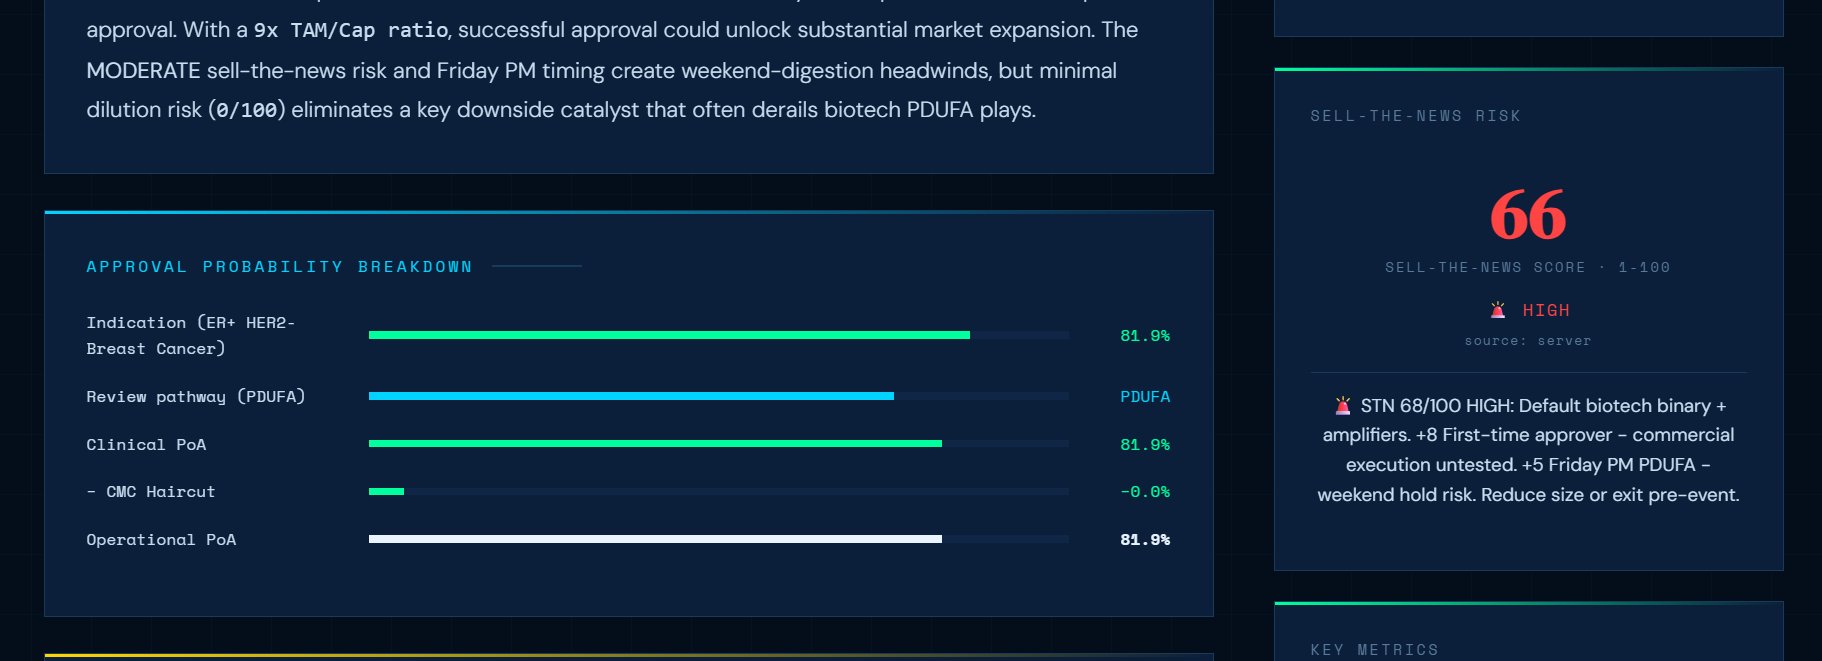
The most recent live test: ARVN. Vepdegestrant — first-in-class PROTAC SERD for ER+/HER2- breast cancer. Scanner ranked it the #1 setup in the PDUFA queue at 81.9% PoA, MINIMAL dilution, 82/100 innovation. FDA approved it 35 days ahead of the scheduled PDUFA. Stock moved +8%. The PoA layer worked, and the STN layer correctly classified it as a real upside event. That's how the system is supposed to behave when the data lines up.
The RCKT event is what made this real. The model said 77.5% chance of approval. It got approved. The stock dropped 20%. I posted the loss publicly and it got 21,000 views. That one outcome led to the Sell-The-News Risk layer, the Dilution Radar, and every feature that separates this from a basic PDUFA calendar.
The two misses are in the record too. REPL on April 10, 2026 — model called 84%, FDA issued a 2nd CRL, stock dropped 64%. STN HIGH had correctly flagged severe downside before the decision. GRCE on April 23, 2026 — model called 72%, FDA issued a manufacturing CRL on nimodipine, stock dropped 52%. STN missed that one. Both losses logged the day they resolved, not after I cherry-picked which to publish. Every outcome gets logged, including the ones that hurt. That's the whole point.
No freemium walls. No data delays. No upsells. Every risk layer on every ticker, updated daily.
Full database · all tickers · all layers
Billed monthly via Stripe · Access within 60 seconds
Straight answers. No filler.
300+ biotechs worth tracking plus every PDUFA filer. Eight risk layers. Every score sourced and documented. $29.99/month, cancel any time. I built this because I needed it — turns out you probably do too.
Start Tracking Catalysts →✓ Cancel any time · ✓ No contracts · ✓ Access within 60 seconds
Upcoming PDUFA dates, new risk classifications, model updates, resolved outcomes. No spam. No financial advice. Unsubscribe any time.
No spam. Just research.